ok so have a common problem with my trades, and I need to rectify it (somehow haven't rectified it in the past two years)
I have been giving my trades room to breathe, but find that once I add-on to the original trade, I start to think I am wrong all the time.
Most recently I was long cable avg. 1.529x for 20 lots. I had the original idea based on my technical system, that 1.5230 would be my exit. Not following my system, I got out in the 70s, for a substantial loss. Had I gone to bed, I would have made ~17% on the trade, with the low being 1.5265...
I need to calculate a position sizing strategy.
Sunday, April 11, 2010

Friday, April 9, 2010
Slowly creating a hypothesis.
In the financial crisis of the 2007-2008, we experienced one of the most disastrous tests of modern economic theory.
During the “sub-prime” crash, a mass scale de-leveraging occurred creating events 26 standard deviations outside the normal. Situations such as these are dubbed “Black Swans”, by author Nassim Taleb in his book “The Black Swan: The impact of the highly improbable”. This event tested equilibrium theory to its limits (this is debatable as the limits are set under money management parameters). Major Hedge Funds were hammered relentlessly as their statistical arbitrage strategies reversed, driving further away from equilibrium instead of towards it. This flight to liquidity was seen several years earlier by a firm named Long Term Capital Management (LTCM).
In 1998, a superstar Quantitative Hedge Fund, LTCM, felt that exact pain, and succumb to it. LTCM had a strategy that involved On the Run, and Off the Run US Treasury Bonds. I should start by saying that liquid assets are usually priced higher than non liquid as they are easier to sell off without a large change in price. LTCM’s strategy was to buy the non-liquid 30 year Treasury bonds, and sell short the liquid On the Run 30 year bonds. This is known as relative value investing (or arbitrage in the modern sense of the word). The theory behind the strategy is that as they are essentially the same instrument, they should have the same value, and should converge on an equilibrium level, which shows profits on being both Long the Off the Run bonds, and Short the On the Run bonds. This turned LTCM into one of the largest funds of its time. That was until the Russian Debt Crisis.
LTCM had spread its strategy into many different markets and added massive amounts of leverage to ramp up its profits. As they assumed equilibrium theory would hold, they could profit. Unfortunately LTCM didn’t calculate human error into their models. When Russian defaulted on its debt, it created a flight to liquidity. The very objects LTCM was short, were being driven to the sky, and the investments they were long, were being demolished to bargain basement deals. They decided to keep buying as equilibrium had to be met at some point, but due to their massive leverage (~40:1) they were bleeding money fast.
Could this be an ideal period for the US to introduce their leverage caps on various markets? Probably, but they decided to wait several years and spend trillions of tax payers money before pointing fingers. LTCM was the first of the great Rocket Science Quant firms to fall.
Karl Popper had a theory. He believed that scientific discoveries are theoretically correct until they are proved wrong. So for the financial markets, you may say “this is the worst event to ever happen to the market”, and that would fuel traders to sell short, pummeling the market until it reaches its exhaustion point. This point is where the panic begins to slow, and the market sentiment begins to shift and they begin to buy again. Could this be applied to quantitative models to prevent future meltdowns?
This is where my theory steps in.
In the Foreign Currency market (FX, FOREX) currencies are priced in fractions of another. I.e. when you are bullish (thinking it will go up) on Cable (British Pound), you buy Cable against another currency that you believe is going to go down against Cable. But when you have two similar base currency crosses such as EUR/USD and GBP/USD then theoretically you should be bearish USD or bullish USD, and as the currency pairs have the same base, they should move in correlation with each other, except with different rates of change. This then has the potential to create a similar, profitable situation. Possibly giving the two a value in terms of each other, then modeling the spreads between them could help prove this theory, but the two already have a cross, EUR/GBP. The problem with the cross is that you are directly selling cable for euro when you are bullish, and vice versa for bearish. That is why I want to try and prove that it is possible for one to model, and profit from this statistical relationship. I view it as a much safer trade than simply buying/selling in the spot market. Yes, you do profit on one position, and lose on the other, but the loss is a hedge which is protecting against the spread widening.
To prove this theory I am trying to create sets of rules that need to be followed in order for this to be possible.
Firstly, defining the relationship between EUR/USD, GBP/USD and EUR/GBP is needed to prove that the no arbitrage theory holds. I will continue to use these pairs, but there are many pairs that work for this style of strategy, and some that probably show much greater profits.
Currency Bid (x) Ask (y)
Euro/Usd (e) 1.50(x1) 1.51(y1)
Gbp/Usd (g) 2.00(x2) 2.01(y2)
EurGbp bid = x3 ask = y3
X3 = x1/y2 y3=y1/x2
X3=(1.50)/(2.01) y3=(1.51)/(2.00)
X3=0.7462 y3=0.7550
Therefore,
x1/y2=x3
y1/x2=y3
Else an arbitrage opportunity arises.
..more to come...want to make sure my numbers are correct, worked all day and cannot think straight.
During the “sub-prime” crash, a mass scale de-leveraging occurred creating events 26 standard deviations outside the normal. Situations such as these are dubbed “Black Swans”, by author Nassim Taleb in his book “The Black Swan: The impact of the highly improbable”. This event tested equilibrium theory to its limits (this is debatable as the limits are set under money management parameters). Major Hedge Funds were hammered relentlessly as their statistical arbitrage strategies reversed, driving further away from equilibrium instead of towards it. This flight to liquidity was seen several years earlier by a firm named Long Term Capital Management (LTCM).
In 1998, a superstar Quantitative Hedge Fund, LTCM, felt that exact pain, and succumb to it. LTCM had a strategy that involved On the Run, and Off the Run US Treasury Bonds. I should start by saying that liquid assets are usually priced higher than non liquid as they are easier to sell off without a large change in price. LTCM’s strategy was to buy the non-liquid 30 year Treasury bonds, and sell short the liquid On the Run 30 year bonds. This is known as relative value investing (or arbitrage in the modern sense of the word). The theory behind the strategy is that as they are essentially the same instrument, they should have the same value, and should converge on an equilibrium level, which shows profits on being both Long the Off the Run bonds, and Short the On the Run bonds. This turned LTCM into one of the largest funds of its time. That was until the Russian Debt Crisis.
LTCM had spread its strategy into many different markets and added massive amounts of leverage to ramp up its profits. As they assumed equilibrium theory would hold, they could profit. Unfortunately LTCM didn’t calculate human error into their models. When Russian defaulted on its debt, it created a flight to liquidity. The very objects LTCM was short, were being driven to the sky, and the investments they were long, were being demolished to bargain basement deals. They decided to keep buying as equilibrium had to be met at some point, but due to their massive leverage (~40:1) they were bleeding money fast.
Could this be an ideal period for the US to introduce their leverage caps on various markets? Probably, but they decided to wait several years and spend trillions of tax payers money before pointing fingers. LTCM was the first of the great Rocket Science Quant firms to fall.
Karl Popper had a theory. He believed that scientific discoveries are theoretically correct until they are proved wrong. So for the financial markets, you may say “this is the worst event to ever happen to the market”, and that would fuel traders to sell short, pummeling the market until it reaches its exhaustion point. This point is where the panic begins to slow, and the market sentiment begins to shift and they begin to buy again. Could this be applied to quantitative models to prevent future meltdowns?
This is where my theory steps in.
In the Foreign Currency market (FX, FOREX) currencies are priced in fractions of another. I.e. when you are bullish (thinking it will go up) on Cable (British Pound), you buy Cable against another currency that you believe is going to go down against Cable. But when you have two similar base currency crosses such as EUR/USD and GBP/USD then theoretically you should be bearish USD or bullish USD, and as the currency pairs have the same base, they should move in correlation with each other, except with different rates of change. This then has the potential to create a similar, profitable situation. Possibly giving the two a value in terms of each other, then modeling the spreads between them could help prove this theory, but the two already have a cross, EUR/GBP. The problem with the cross is that you are directly selling cable for euro when you are bullish, and vice versa for bearish. That is why I want to try and prove that it is possible for one to model, and profit from this statistical relationship. I view it as a much safer trade than simply buying/selling in the spot market. Yes, you do profit on one position, and lose on the other, but the loss is a hedge which is protecting against the spread widening.
To prove this theory I am trying to create sets of rules that need to be followed in order for this to be possible.
Firstly, defining the relationship between EUR/USD, GBP/USD and EUR/GBP is needed to prove that the no arbitrage theory holds. I will continue to use these pairs, but there are many pairs that work for this style of strategy, and some that probably show much greater profits.
Currency Bid (x) Ask (y)
Euro/Usd (e) 1.50(x1) 1.51(y1)
Gbp/Usd (g) 2.00(x2) 2.01(y2)
EurGbp bid = x3 ask = y3
X3 = x1/y2 y3=y1/x2
X3=(1.50)/(2.01) y3=(1.51)/(2.00)
X3=0.7462 y3=0.7550
Therefore,
x1/y2=x3
y1/x2=y3
Else an arbitrage opportunity arises.
..more to come...want to make sure my numbers are correct, worked all day and cannot think straight.
Tuesday, March 30, 2010
Example of strategy using made up numbers
Euro bid/ask: 1.50/1.51
Cable bid/ask: 2.00/2.01
Market moves, Euro increases more than Cable:
Euro Bid/Ask: 1.60/1.61
Cable Bid/Ask: 2.05/2.06
so if euro was over valued in relation to cable, I would go short euro and long cable creating:
Euro: ($100)
Usd: $160
Gbp: $77.66
Usd: ($160)
Momentum hits cable as USD is being sold off, rates become:
Euro bid/ask: 1.63/1.64
Cable bid/ask: 2.20/2.21
So your position becomes:
Euro: ($100)
Usd: $163.00
Gbp: 77.66
Usd: ($171.63)
you would then cover your position creating:
Euro: $100
Usd: ($164.00)
Cable: ($77.66)
Usd: $170.85
Profit in USD including theoretical spreads being: P=170.85-164.00 =$6.85
Now to calculate margin requirement so that you can calculate RoR %:
Leverage: 10:1
Euro Margin (EM) : $16.50
Cable Margin (CM): $16.50
Profit (P) = 6.85
RoR (%) = [P/(EM+CM)]*100
Thus:
RoR = [6.85/33.00]*100
Ror = 20.76%
Now biggest Item would be how to price one in relation to the other so that it is possible to spot these type of positions...
Time to goto the Library!
Cable bid/ask: 2.00/2.01
Market moves, Euro increases more than Cable:
Euro Bid/Ask: 1.60/1.61
Cable Bid/Ask: 2.05/2.06
so if euro was over valued in relation to cable, I would go short euro and long cable creating:
Euro: ($100)
Usd: $160
Gbp: $77.66
Usd: ($160)
Momentum hits cable as USD is being sold off, rates become:
Euro bid/ask: 1.63/1.64
Cable bid/ask: 2.20/2.21
So your position becomes:
Euro: ($100)
Usd: $163.00
Gbp: 77.66
Usd: ($171.63)
you would then cover your position creating:
Euro: $100
Usd: ($164.00)
Cable: ($77.66)
Usd: $170.85
Profit in USD including theoretical spreads being: P=170.85-164.00 =$6.85
Now to calculate margin requirement so that you can calculate RoR %:
Leverage: 10:1
Euro Margin (EM) : $16.50
Cable Margin (CM): $16.50
Profit (P) = 6.85
RoR (%) = [P/(EM+CM)]*100
Thus:
RoR = [6.85/33.00]*100
Ror = 20.76%
Now biggest Item would be how to price one in relation to the other so that it is possible to spot these type of positions...
Time to goto the Library!
Statistical Arbitrage Idea (Attempt #1)
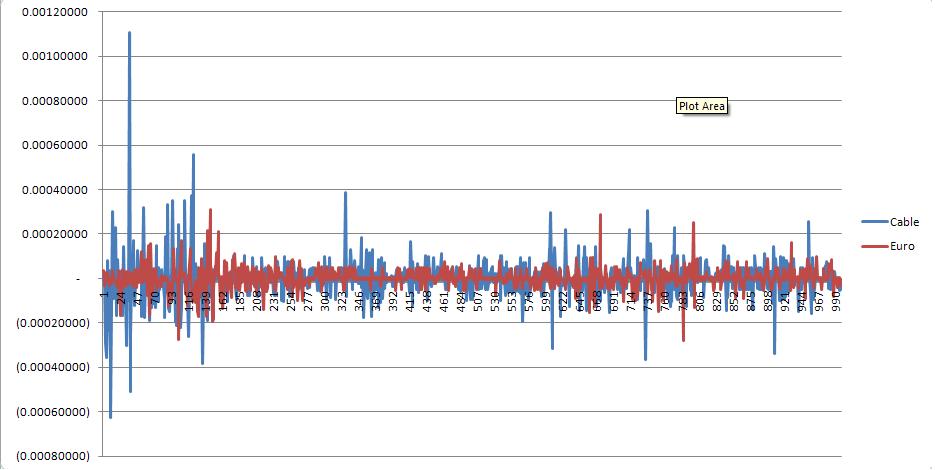
Ok so I want to try and prove that there is a way to profit (including spread) between two correlated FX pairs.
I picked Euro and Cable over 1000 ticks (thanks to Leslie for finding truefx.com).
Basically I gave a mean value for the bid/ask just to prove if the theory could even work, then created a +/- value for each tick from the median. So Each new tick is either + or - the previous. Notice how there are a couple very large movements on cable, while euro does not move much? I think that this proves that there is potential in my idea.
I think the next step is that I need to find a way to give value to each pair in value of the other, this will give a base to see if its profitable with spreads. Then I need to prove if the prices revert so that the position could be closed.
edit: I know its not much data to prove the point, but figured testing small sample first to create the calculations would be better than dealing with many lines.
Sunday, March 28, 2010
QME
ok so I have my last test on Trig, Exponential Functions, and Logarithmic functions on Wednesday March 31st, and then my exam on April 7th.
Started trying to plan out my undergrad so that I can be well equiped for MFE, or CQF, and started to build a reading list.
Going to pick up Ross' Introduction to Probability Theory this week, and picked up Thorp's 'Beat the Dealer' because I couldn't find a reasonably priced 'Beat the market' (which I found at the University's library :) ).
anywho...lots of over extended markets tonight, took USDJPY short @ 92.6610...might be adding EURYEN and GBPYEN but depends on how it reacts to the highs its going into.
Started trying to plan out my undergrad so that I can be well equiped for MFE, or CQF, and started to build a reading list.
Going to pick up Ross' Introduction to Probability Theory this week, and picked up Thorp's 'Beat the Dealer' because I couldn't find a reasonably priced 'Beat the market' (which I found at the University's library :) ).
anywho...lots of over extended markets tonight, took USDJPY short @ 92.6610...might be adding EURYEN and GBPYEN but depends on how it reacts to the highs its going into.
Monday, March 8, 2010
finally
Spent the last 3 weeks cleaning a virus off of my computer.
Finally have it fixed, and everything back to normal.
Took dllryen short 91.929 before I started fighting the virus, and thankfully forexnews.com allows me to track rates from my blackberry. Currenex is Java based so works from almost anywhere which is helpful for next time.
anywho.
I am still bearish markets, and insanely bullish on inflation right now. Almost to the point that we should be worried.
The economy cannot handle inflation until it sees more jobs.
As for me going to live trading again I have steps setup, I just need things to fall into place.
I need a constant source of income for the summer. If that happens, I go live in September while at school using fractual compounding MM, and logical market analysis. I have been networking my ass off to find something I can get full-time hours, but nobody is hiring yet. I hope to hear back within the next couple weeks or I will intensify even more.
I need to get back to trading, and stop making excuses as to why. If I want something I need to take it, Its not going to jump and land on my lap.
Finally have it fixed, and everything back to normal.
Took dllryen short 91.929 before I started fighting the virus, and thankfully forexnews.com allows me to track rates from my blackberry. Currenex is Java based so works from almost anywhere which is helpful for next time.
anywho.
I am still bearish markets, and insanely bullish on inflation right now. Almost to the point that we should be worried.
The economy cannot handle inflation until it sees more jobs.
As for me going to live trading again I have steps setup, I just need things to fall into place.
I need a constant source of income for the summer. If that happens, I go live in September while at school using fractual compounding MM, and logical market analysis. I have been networking my ass off to find something I can get full-time hours, but nobody is hiring yet. I hope to hear back within the next couple weeks or I will intensify even more.
I need to get back to trading, and stop making excuses as to why. If I want something I need to take it, Its not going to jump and land on my lap.
Sunday, January 31, 2010
Updates...
So starting to become frustrated with my trading.
While I have been going over my Jan010 trades, I have noticed common problems:
A. I have issues with position sizing for the account. I need to learn how to scale into a position. Started with 1:1 and ended up 14:1 on the account, only to have it go the direction I was feeling after I was stopped out (was short cable). This leads me to show that my logic is correct, it is just my timing and Risk Management that needs to be addressed.
B. Time commitment. I cannot afford to sit in front of the computer trading a demo account. Simply as that. Paper Profits cannot pay bills. Even if it is for the track record.
C. Capital. I Cannot deem trading anything under $100k. It doesn't pay the bills, even on good months. Unless there is salary involved (even if its small). Seeing how my trading methodology is based on sustainability, you cannot be sustainable when you cannot pay your bills.
Starting to come to conclusion that trading is becoming a hobby and not a goal. I take two steps forward, and three back. Work is slow, but not slow enough to give me adequate time to trade. Slow means no money, this is leaving me to look for a second job just to pay rent. Becoming worried that if I even get into Quantitative Economics @ university for September, I will not have enough cash to stay there. Becoming a sink or swim mindset...paying my way into a prop firm will put me another $5k into debt (making $10k) but has the possibility to push my foot in the door for a track record (prop firm pays 50% commission). But if I preform poorly, then I am out 5k and I go home to $10k of debts with a terrible job. I honestly do not know what to do anymore other than get a second job and try to keep afloat.
“Strength does not come from winning. Your struggles develop your strengths. When you go through hardships and decide not to surrender, that is strength.”
While I have been going over my Jan010 trades, I have noticed common problems:
A. I have issues with position sizing for the account. I need to learn how to scale into a position. Started with 1:1 and ended up 14:1 on the account, only to have it go the direction I was feeling after I was stopped out (was short cable). This leads me to show that my logic is correct, it is just my timing and Risk Management that needs to be addressed.
B. Time commitment. I cannot afford to sit in front of the computer trading a demo account. Simply as that. Paper Profits cannot pay bills. Even if it is for the track record.
C. Capital. I Cannot deem trading anything under $100k. It doesn't pay the bills, even on good months. Unless there is salary involved (even if its small). Seeing how my trading methodology is based on sustainability, you cannot be sustainable when you cannot pay your bills.
Starting to come to conclusion that trading is becoming a hobby and not a goal. I take two steps forward, and three back. Work is slow, but not slow enough to give me adequate time to trade. Slow means no money, this is leaving me to look for a second job just to pay rent. Becoming worried that if I even get into Quantitative Economics @ university for September, I will not have enough cash to stay there. Becoming a sink or swim mindset...paying my way into a prop firm will put me another $5k into debt (making $10k) but has the possibility to push my foot in the door for a track record (prop firm pays 50% commission). But if I preform poorly, then I am out 5k and I go home to $10k of debts with a terrible job. I honestly do not know what to do anymore other than get a second job and try to keep afloat.
“Strength does not come from winning. Your struggles develop your strengths. When you go through hardships and decide not to surrender, that is strength.”
Subscribe to:
Posts (Atom)
